
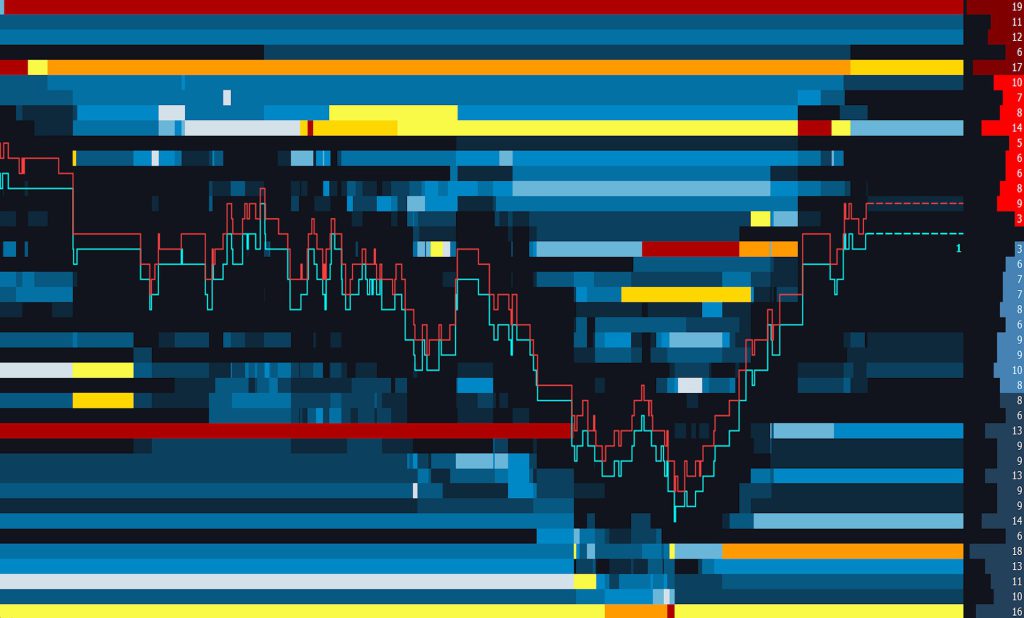
Market Depth Map helps traders identify potential levels of support and resistance by analyzing the volumes of limit order book (DOM). Each price level takes on a different color depending on the volume of corresponding DOM level. The higher the volume, the greater the intensity of color and, the greater the intensity of color, the higher the probability of identifying a support or resistance.
The purpose of volume analysis is to understand market movements in advance by highlighting possible support or resistance levels or, more generally, possible market pivot points.
Market Depth Map is part of a set of indicators for volume analysis essential to understand market movements in advance. This set also includes Volume Profile, TPO-Profile (market-profile®) , Volume Ladder (footprint®), Volume Bubbles, Volume Delta, VWAP, Volume-Meter, Volume on Bid/Ask, Session Statistics and others.
Most of these indicators show the volume traded across the various price levels, highlighting buyers and sellers.
Important features:
We recommend you ALWAYS use the Market Depth Map on 1-Tick (or 1-second at most) resolution charts. Using it at higher resolutions you will lose a lot of details.
- Market Depth Map works only in real-time with limit order book (DOM) data. Initially this indicator does not display historical data.
- Overtime, real-time data from the DOM is collected and displayed on screen at each price level, respective to the amount of volume at that level.
- The higher the volume, the more intense the color will be. This type of coloration, called a heatmap, is very efficient in identifying potential levels of support and resistance.
Market Depth Map is fully customizable according to user preferences. For example, the price levels can be colored in single color, multiple colors or by Bid/Ask area.
You can choose what to display on screen, the refresh rate, how to aggregate the segments within the same level, whether or not to filter volumes and much more.
Calculation Properties
You can access calculation properties from Properties Tab of the indicator configuration window.
Max Number of Bid/Ask Levels to consider: specifies maximum number of Bid/Ask levels to consider. For example, setting 30, best 30 Bid levels and best 30 Ask levels will be considered in the calculation for a total of 60 levels. The number of levels considered affects the calculation and graphic refresh performance. Set this property correctly according to your needs and PC performance. If you notice any slowdowns, decrease the number of levels to consider.
Volume Smoothing: defines the smoothing of single adjacent volumes on the same price level. The higher the smoothing, the smoother the colors within single price level will be. A low smoothing value will correspond to a very fragmented price level. In other words, price level will most likely consist of numerous adjacent rectangles with different (even slightly) shades of color from each other. Conversely, a high smoothing value will correspond to a slightly fragmented price level, consisting of a few adjacent and distinct rectangles. This property affects calculation and graphics refresh performance. A low smoothness value will adversely affect calculation and refresh performance. Set this property correctly according to your needs and PC performance. If you notice any slowdowns, increase smoothing level.
Refresh Rate: specifies indicator refresh rate. Set this property correctly according to your needs and PC performance. If you notice any slowdowns, decrease refresh rate.
Style Properties
You can access style properties from Style Tab of the indicator configuration window.
WARNING: In addition to the properties listed here, there are many other properties that are minor or do not need further explanation.
Heatmap (Background)
Gradient Type:
- Single Color: coloring based on a single color gradient
- Single Color – Bid/Ask: coloring based on a gradient of 2 different colors, one for bid levels and the other for ask levels
- Multiple Colors #1 e #2: classic multicolor gradient
- Multiple Colors – Custom: multicolor gradient with the possibility to customize colors
Color Intensity Filter: specifies minimum color intensity to display. The higher the value, the LESS color shades will be displayed. In other words, all shades of color with intensity less than the specified value will NOT be displayed. Together with Upper and Lower Cut-Off properties, it helps to better filter the background noise caused by low volume levels, showing only high volume areas.
Extend Last Known Volume: extends coloring of current volume to the right beyond last bar (up to Y axis).
Bid/Ask levels to center the chart: specifies number of bid/ask levels to always keep visible when Y-axis scale is set to ‘Screen‘. In other words, by setting this value for example to 20, best 20 Bid levels and best 20 Ask levels (for a total of 40 price levels) will always be visible on screen, resulting in an (approximate) centering of indicator with respect to Y-axis
Real-Time Depth Details
Drawn on chart right side (immediately before Y-axis), it represents current DOM.
Bid/Ask levels take on 2 different color intensities. Levels with higher color intensity represent current and updated DOM levels, while levels with lower color intensity represent NOT-updated DOM levels, or better, updated levels with last known bid/ask volume. This situation arises when a data-feed only provides a limited number of bid/ask levels.
Volume Range – Upper Cut-Off
Use this section to cut the top of volume range by a defined fixed value or percentage:
- Exact Value: for example, by setting 150, all levels/areas with a volume greater than 150 will NOT be displayed on chart.
- Percentage: for example, by setting 90%, all levels/areas with volume greater than 90% of maximum volume reached in current bid/ask levels will NOT be displayed on chart.
Volume Range – Lower Cut-Off
Use this section to cut the bottom of volume range by a defined fixed value or percentage:
- Exact Value: for example, by setting 120, all levels/areas with a volume lower than 120 will NOT be displayed on chart.
- Percentage: for example, by setting 30%, all levels/areas with a volume lower than 30% of the average volume of bid/ask levels visible on screen will NOT be displayed on chart.
Bid/Ask
This section contains all style properties to draw or not Bid/Ask curves on chart. For example, you can choose whether to draw the entire curves or highlight only best bid/ask levels.
Current Time Vertical Line
This section contains all style properties for drawing or not a vertical line next to last bar on chart.
Post a Comment