
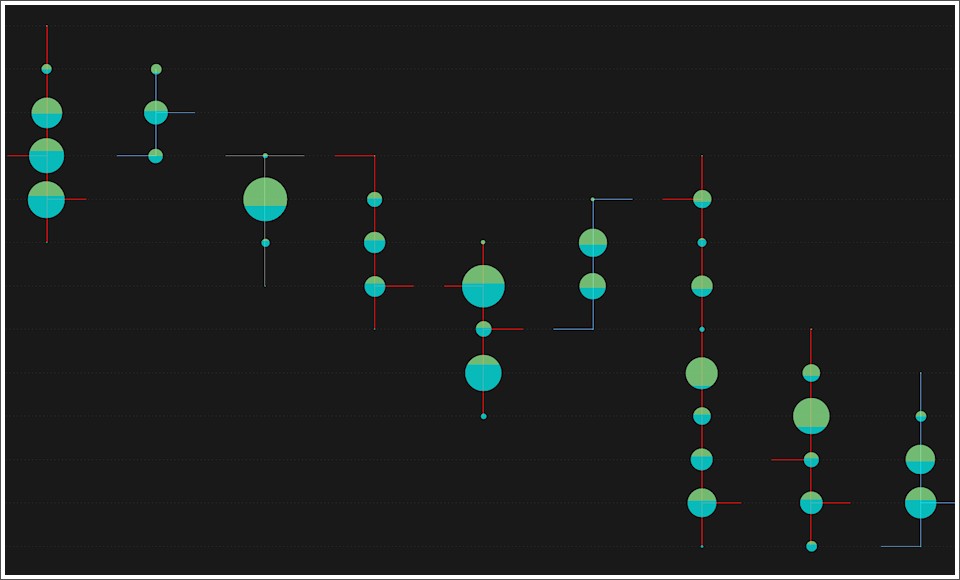
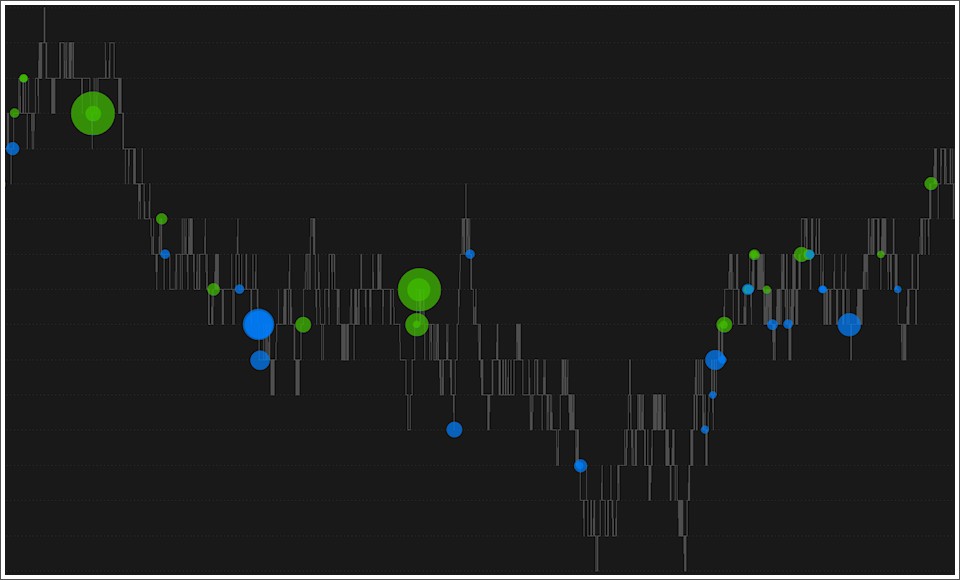
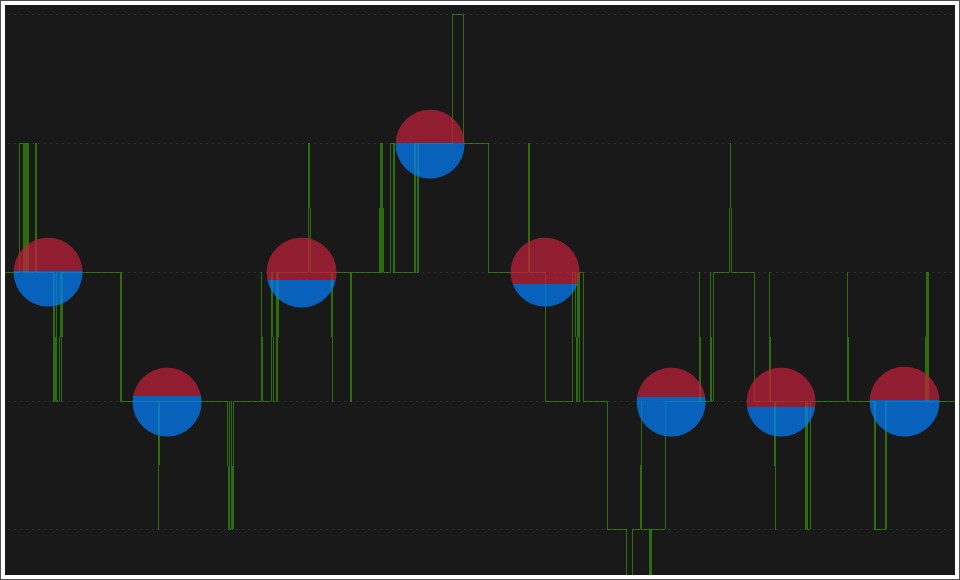
Volume Bubbles displays on chart the traded volume in form of bubbles (dots) of different size depending on the amount of volume represented. This volume view mode allows you to easily and quickly identify price levels where the largest trades took place and whether sellers or buyers predominated
The purpose of volume analysis is to understand market movements in advance by highlighting possible support or resistance levels or, more generally, possible market pivot points.
Volume Bubbles is part of a set of indicators for volume analysis essential to understand market movements in advance. This set also includes Volume Profile, TPO-Profile (market profile®), Volume Ladder (footprint®) Market Depth Map (heatmap), Volume Delta, VWAP, Volume-Meter, Volume on Bid/Ask, Session Statistics and others.
Most of these indicators show the volume traded across the various price levels, highlighting buyers and sellers.
Calculation Properties
You can access calculation properties from Properties Tab of the indicator configuration window.
Calculation Method: specifies how the volume of every single tick is assigned to Bid or Ask:
- Tick Direction: volume is assigned to Bid or Ask based on direction of current tick compared to previous one. In other words, if current tick price is higher than previous one the volume is assigned to Ask, if lower it is assigned to Bid, if equal it is assigned to bid or ask based on the last assignment made.
- Bid/Ask: volume is assigned to Bid if seller is the aggressor, or to Ask if buyer is the aggressor. If the aggressor is unknown and price is between bid and ask, the volume is assigned to bid or to ask depending on last assignment made.
Accumulate Volume: to form each individual bubble, volume is aggregated using one of the following methods:
- Every Price Level: Displays a bubble for each price level traded within each single bar. In other words, each bubble represents the total volume traded at that price level in that single bar.
- Until bid/ask remain unchanged: Volume will continue to accumulate to form a bubble as long as the Bid/Ask levels remain unchanged. If the bid or ask price changes, a new bubble will begin to form. The bubble will be plotted on last price.
- If tick size is Greater or Equal to Minimum Size: A bubble will be plotted for each tick that has a volume equal or greater than the defined minimum value. Useful for highlighting only high volume trades by filtering out the background noise caused by small trades.
- Every x Time: A new bubble will be drawn every x seconds/minutes and the volume represented will be the total volume traded in that time interval.
- Until Volume is Lower or Equal to: A new bubble will be drawn upon reaching a certain volume threshold. Volume represented by single bubbles will be very similar to each other.
Time Range: specifies the number of trading sessions/days on which to calculate the indicator. 1-tick resolution data is used to calculate the indicator. For this reason we recommend you not to overdo the time range. Data loading and calculation times progressively increase with the time range. However, there is no recommended time range to use. It depends on many factors and in particular on your PC performance, your Internet line and your data feed. Set this property correctly according to your needs and the performance of your PC/data-feed. If you notice very long loading times, decrease the time range.
- A maximum of 10 bubbles will be drawn for each individual bar. These bubbles will be the 10 bubbles with the greatest volume.
- A maximum of 1000 bubbles will be drawn on chart. This means that if in a certain chart zoom there are more than 1000 bubbles to display, only the 1000 bubbles with the greatest volume will be plotted.
Style Properties
You can access style properties from Style Tab of the indicator configuration window.
WARNING: In addition to the properties listed here, there are many other properties that are minor or do not need further explanation.
Bubble
You can define the maximum size (in pixels) of bubble, its transparency, and bid/ask color.
Drawing Type: two coloring modes:
- Solid: bubble is split into two parts and colored using two distinct colors representing the quantity traded on bid and ask.
- Gradient: bubble is colored using a bid/ask color scale.

Post a Comment