
Volume Profile (Range) allows you to build a volume profile over a certain time interval drawn manually on chart just like any drawing tool (trendline etc.)
Calculation Properties
You can access calculation properties from Properties Tab of the indicator configuration window.
Calculate using: specifies whether to use Volume or Tick Count (number of trades) to calculate the indicator. Unless you have special needs, we recommend you use the Volume.
Time Range: specifies the calculation start and end date/time. By selecting Attach to last bar property, the end date is ignored and volume profile is always calculated up to the last available bar.
If you are using 1-Tick resolution data to build the indicator, we recommend you not to overdo the time range. Data loading and calculation times progressively increase as the time interval increases. However, there is no recommended maximum time interval. It depends on many factors and in particular on your PC performance, your Internet line and your data feed. Set this property correctly according to your needs and the performance of your PC/data-feed. If you notice very long loading times, decrease the time range.
Value Area (%): specifies the Value Area width (as a percentage). Typical value of this property is 68.2 (default). We recommend you do not change it unless you have special needs.
Ticks per Row: specifies the width (in ticks) of each single price level. A tick is the smallest price movement (tick-size) defined in the instrument configuration. Usually, the correct value for this property is 1. For some instruments, where the tick-size is very small compared to the current price (eg US stocks), it may be necessary to group a number of price levels into a single level by setting this property to a value greater than 1.
Resolution: defines the resolution of data to be used to calculate the indicator:
- Same as chart: 1-Tick, 1-Minute or 1-Day resolution is used depending on chart resolution
- 1-Tick: use this resolution to get the best possible volume profile (highest definition). It is NOT not recommended if time interval where the volume profile is calculated is greater than a few days, due to the huge amount of data needed for the calculation. Data loading and calculation times can be long.
When the resolution is 1-Tick, by setting Bid/Ask – Calculation Method property you can choose with which calculation method the volume of every single tick is assigned to Bid or Ask:- Tick Direction: volume is assigned to Bid or Ask based on direction of current tick compared to previous one. In other words, if current tick price is higher than previous one the volume is assigned to Ask, if lower it is assigned to Bid, if equal it is assigned to bid or ask based on the last assignment made.
- Bid/Ask: volume is assigned to Bid if seller is the aggressor, or to Ask if buyer is the aggressor. If the aggressor is unknown and price is between bid and ask, the volume is assigned to bid or to ask depending on last assignment made.
- 1-Minute: use this resolution to get an approximate volume profile (recommended if time interval where the volume profile is calculated is greater than a few days). Data loading and calculation times are very short
- 1-Day: use this resolution to get an even more approximate volume profile and only if the defined time range is many years. Data loading and calculation times are very short
If data resolution is other than 1-Tick, total bar volume is assigned to price level corresponding to the bar close.
In addition to the properties listed here, there are many other properties that are minor or do not need further explanation.
Style Properties
You can access style properties from Style Tab of the indicator configuration window.
WARNING: In addition to the properties listed here, there are many other properties that are minor or do not need further explanation.
Volume Profile
Direction: specifies volume-bars direction: from Right to Left or Left to Right.
Position: specifies volume profile position relative to the time interval on which it is built. You can place the volume profile at the beginning or end of the range (internally or externally).
Width: specifies the volume-profile width as a percentage or pixels. If percentage, the volume-profile width will be a percentage of volume-profile reference area.
Display as: specifies how volume profile is displayed:
- Volume: volume bar is colored with a single color. Color changes according to the zone to which the bar belongs (internal or external to the Value Area) and will be more or less intense depending on bar volume and the opacity (min/max) specified.
You can choose between a classic or smoothing style and whether or not to draw only the border (useful for making the volume profile less flashy). - Bid/Ask: volume bar is divided into 2 parts of different colors corresponding to the volume generated on BID and the volume generated on ASK. This displaying type requires the use of 1-Tick resolution data to build the indicator.
- VPOC Only: only VPOC bar is displayed.
Delta Profile
Delta Profile is often used to complement the volume profile and shows the delta of each price level. In other words, the difference between volumes generated on ASK minus volumes generated on BID.
You can choose whether to draw Delta Profile together with Volume Profile, as an alternative to Volume Profile, or not to draw it. However, to draw Delta Profile you need to use 1-Tick resolution data to build the indicator
In case volume profile is drawn together with delta profile, some style and position properties are inherited from volume profile
Direction: specifies bars direction: from Right to Left or Left to Right.
Position: specifies whether to draw Delta Profile on the right, left or overlapped on volume profile. In case Volume Profile is NOT visible, it specifies the position of delta profile with respect to the time interval on which it is built.
Width: specifies the width of delta profile as a percentage of total space reserved for volume profile + delta profile. For example, if total space of volume profile + delta profile is 100 pixels and the width of delta profile is 30%, then volume profile and delta profile will be 70 and 30 pixels wide respectively (total space reserved for volume profile + delta profile is defined in volume profile Width property).
If volume profile is NOT visible, you can set delta-profile width in percentage or pixels. If percentage, delta profile width will be a percentage of delta-profile reference area.
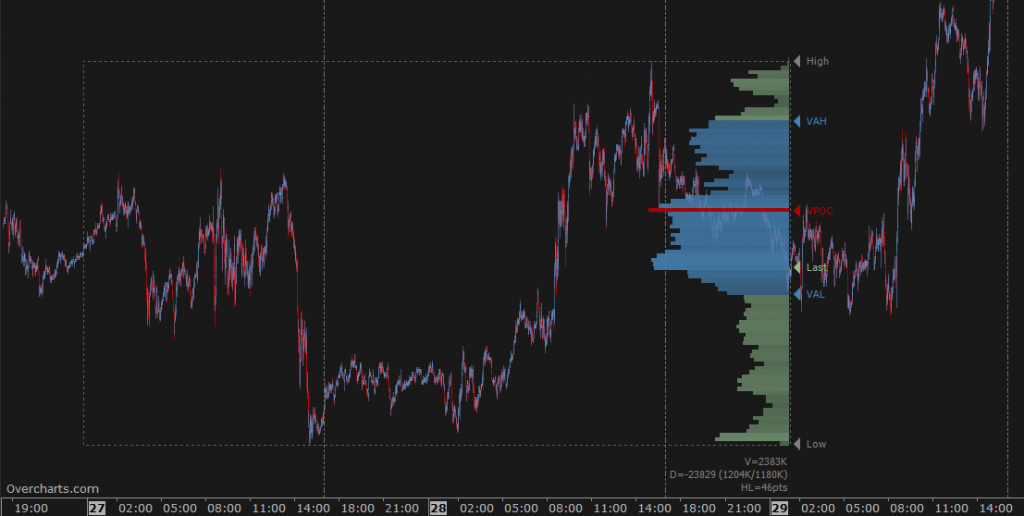
VPOC (Volume Point of Control)
VPOC is the price level with the greatest volume, around which the value area is calculated. Use properties available in this section to draw or not the VPOC and set it according to your needs.
Naked Line: is a horizontal line drawn from VPOC and extended to the end of chart (right side).
VPOC Trace Line
Trace-Line is a broken line showing the VPOC position over time within the period where the volume profile is calculated. Use properties available in this section to draw or not the Trace-Line and set it according to your needs.
Outline
Displays with a rectangle, the time and price interval where Volume Profile is calculated.
Labels/Markers/Level Lines
You can highlight through a label and/or a horizontal line some significant price levels such as Open, High, Low, Last, Middle, VPOC, Value Area (high/low) etc. Set according to your needs which levels to display using the properties available in this section.
Summary
You can display at the volume profile bottom some summary values such as Total Volume, Total Delta, High/Low Range. Set according to your needs which summary values to show using the properties available in this section.
Post a Comment