
The purpose of volume analysis is to understand market movements in advance by highlighting possible support or resistance levels or, more generally, possible market pivot points
Volume Profile is part of a set of indicators for volume analysis essential to understand market movements in advance. This set also includes the TPO-Profile, Volume Ladder (footprint), Market Depth Map (heatmap), Volume Bubbles, Volume Delta, VWAP, Volume-Meter, Volume on Bid/Ask, Session Statistics and others.
Most of these indicators show the volume traded across the various price levels, highlighting buyers and sellers.
Types of Volume Profiles available
In Overcharts there are different types of Volume Profiles to use depending on the indicator frequency.
Volume Profile – Intraday
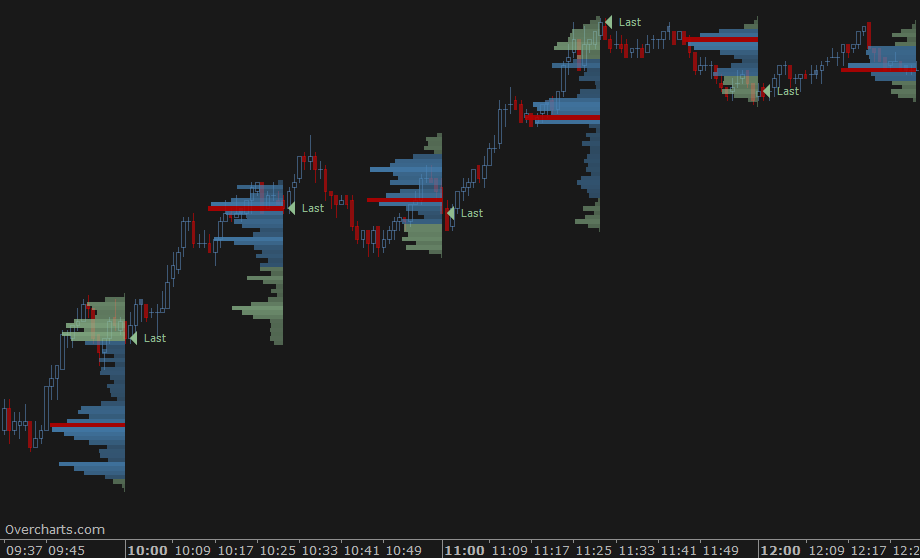
It allows you to build a volume profile every x minutes or bars within a daily session
For example, on a 1-minute chart you can build a volume profile every 30 minutes:
or on a 30-minute chart you can build a volume profile for each bar. In this case, set the space between bars appropriately to optimize the display:
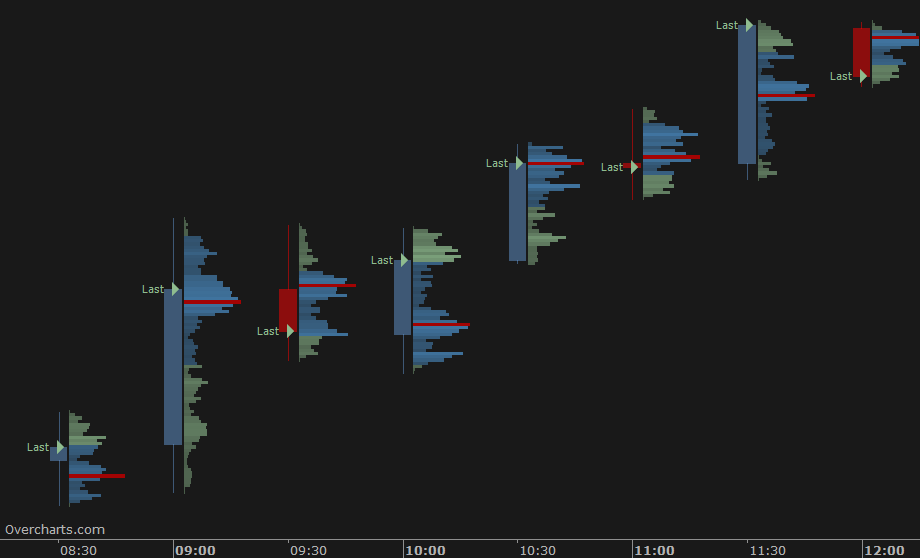
You have infinite combinations between chart and indicator frequency (minutes or bars). The only limitation is that the chart must have an INTRADAY resolution less than or equal to the volume profile frequency. To be clear, you CANNOT build a 30-minute Volume Profile on a 60-minute resolution chart.
Volume Profile – Session
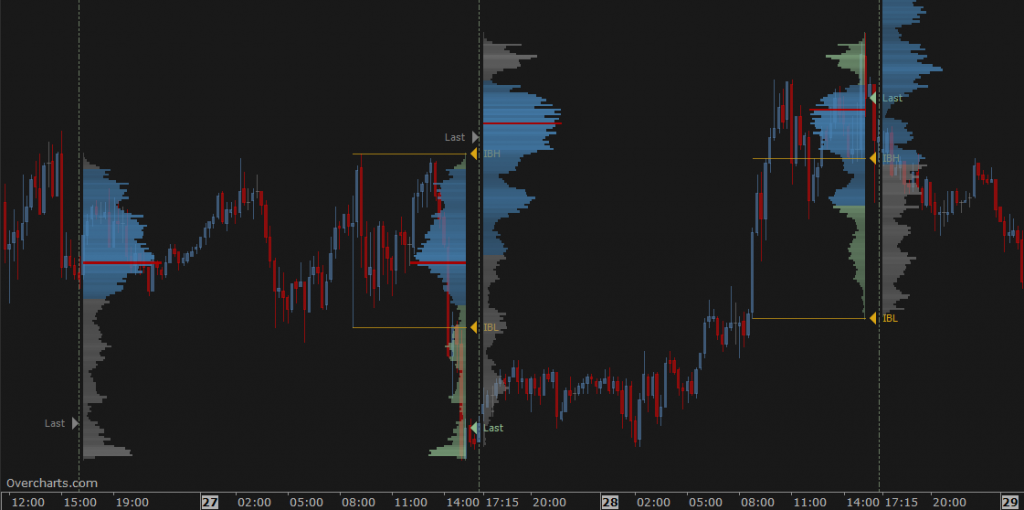
It allows you to build a volume profile for each trading session
In the indicator configuration you can set up to 4 different sessions relating to the daily market phases:
- RTH: represents the regular trading hours, in other words the hours when the market is actually open
- pre-RTH: represents the hours BEFORE RTH session
- post-RTH: represents the hours AFTER RTH session
- ETH: represents the entire daily trading session including all 3 previous sessions (pre-RTH + RTH + post-RTH)
These trading session types are used for example by CME (Chicago Mercantile Exchange), but not only.
In most cases you will only set RTH session (default) or ETH. In other cases you may want to use the same indicator to view both RTH and ETH volume profile, or even split the day between Pre-RTH and RTH sessions.
Example with RTH and ETH sessions set:
Volume Profile Session can ONLY be used on charts with intraday resolutions
Volume Profile – Long Term
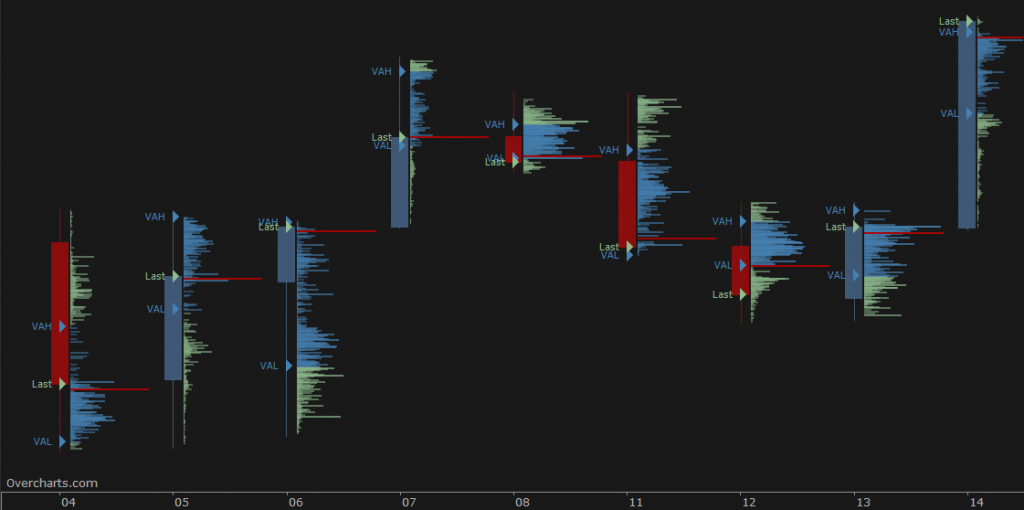
It allows you to build a volume profile with a frequency of x days, weeks, months or years
For example, use this indicator to build a Volume Profile for each bar on a daily chart by setting volume profile frequency equal to 1-Day:
or a weekly volume profile on a daily chart:
You have infinite combinations between chart and indicator frequency. The only limitation is that the chart must have a resolution less than or equal to the volume profile frequency. To be clear, you CANNOT build a 1-day Volume Profile on a 1-week resolution chart.
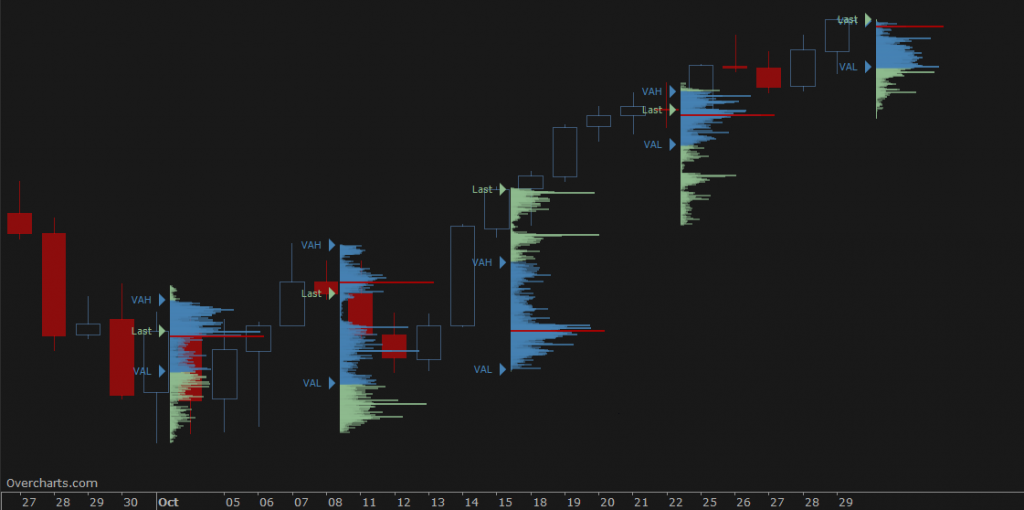
Volume Profile – Composite
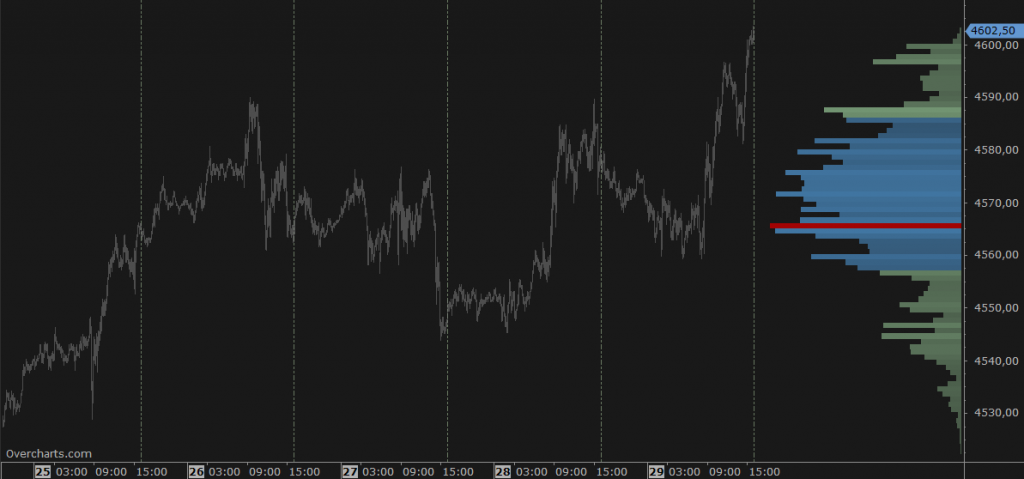
It allows you to build a summary Volume Profile of the last x sessions, days, weeks, months, years or starting from a specific date/time up to the last available bar
It is drawn on the right or left side of the chart:
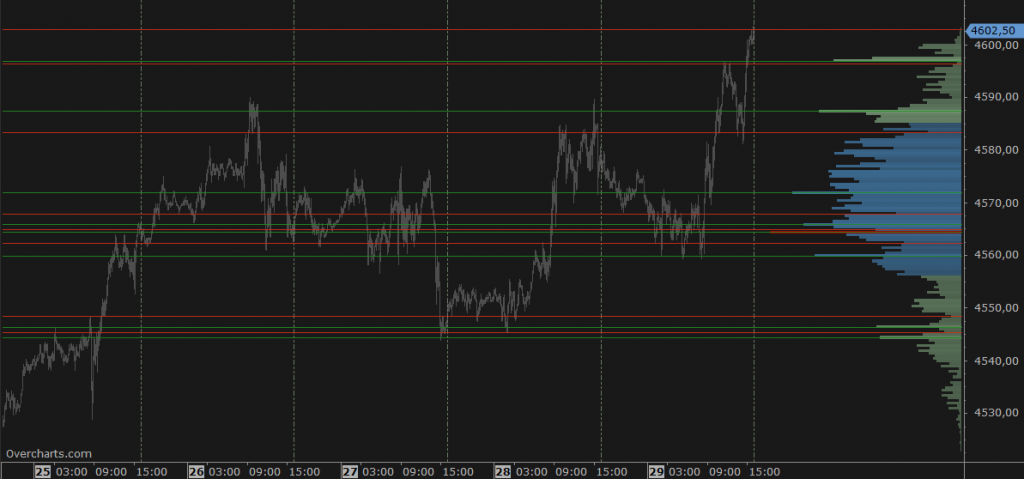
Composite Volume Profile also allows you to automatically draw horizontal lines corresponding to the volume profile peaks and valleys. These are potential support/resistance levels at significant peaks/valleys:
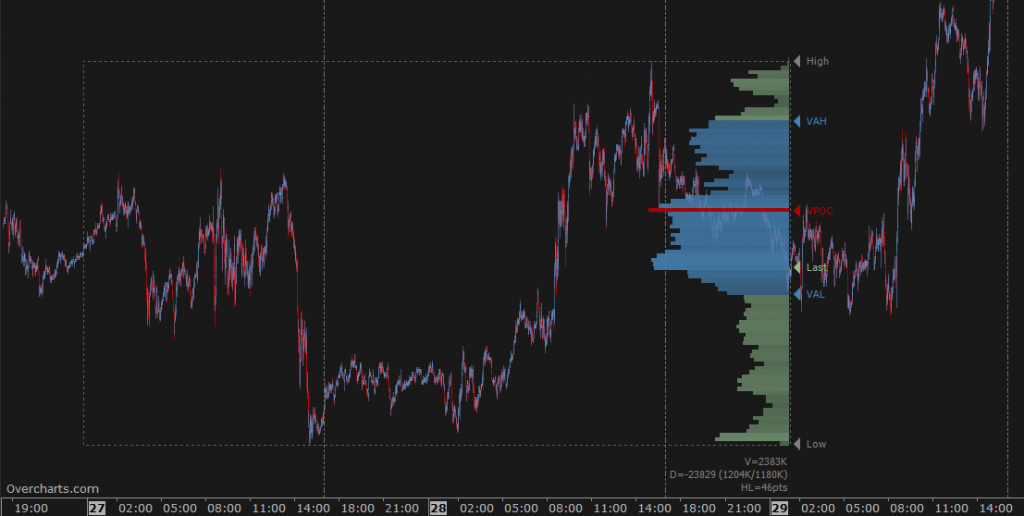
Volume Profile – Range
It allows you to build a volume profile over a certain time interval drawn manually on chart just like any drawing tool (trendline etc.)
Click HERE to learn more about the configuration properties available for the Range Volume Profile
Style Tips
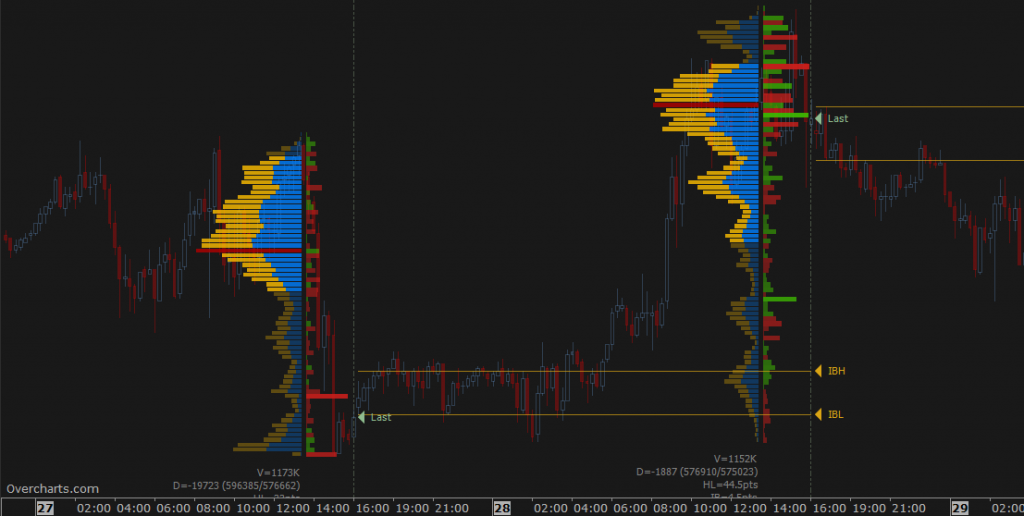
1. You can display the Volume Profile in Bid/Ask mode. This type of visualization requires the use of 1-Tick resolution data to build the indicator.
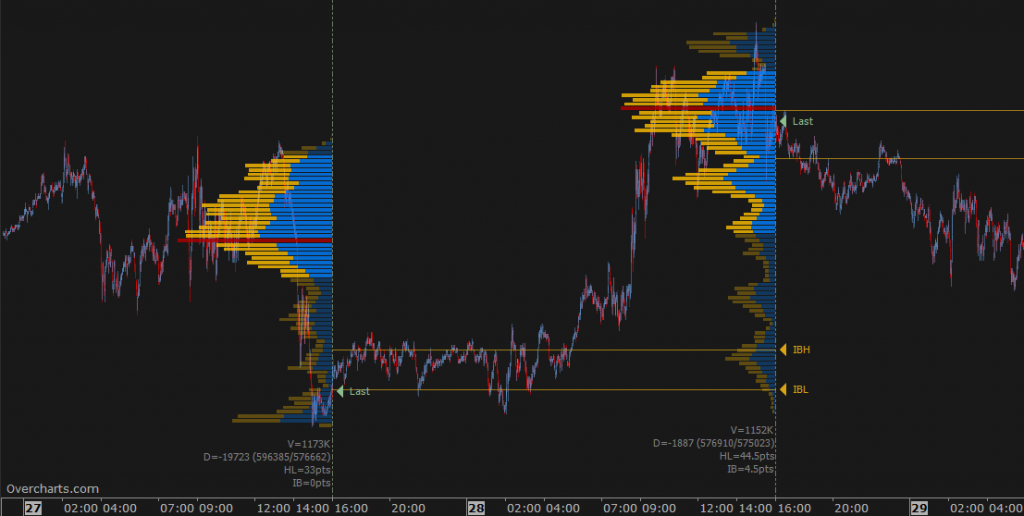
2. You can draw a Delta-Profile side by side (right or left) or overlapped on Volume Profile. To draw Delta Profile you need to use 1-Tick resolution data to build the indicator.
3. If volume profile is drawn on each bar, set the space between bars appropriately to optimize the display:
FREQUENTLY ASKED QUESTIONS
Not enough data to draw the object
If a message similar to Not enough data to draw the object appears in the volume profile status line within the chart:
- make sure you are connected to your data feed. If you are not connected to the data feed, data cannot be downloaded
- if you are connected to the data-feed and are using 1-Tick data to build the indicator, then your data-feed probably does NOT provide 1-Tick resolution historical data. In this case you cannot build a Volume Profile using 1-Tick data (better resolution), but you must use 1-Minute data by correctly setting Resolution property in the indicator configuration.
Volume Profile is drawn on an incorrect time interval
If Volume Profile is drawn on an incorrect time interval, check that you have set the right session in relation to the underlying instrument. Session is a FUNDAMENTAL parameter for the Volume Profile calculation! Set the session correctly in the indicator configuration.
Partial Volume Profile
If you notice a lack of data in the chart, or a partial Volume Profile:
- make sure you are connected to your data feed. If you are not connected to the data feed, data cannot be downloaded
- if you are connected, it is most likely a temporary data feed issue regarding the availability of historical data.
Grouping multiple price levels
For some instruments, where the tick-size is very small compared to the current price (typical of US stocks), it may be necessary to group a number of price levels into one level. Correctly set the Ticks for Row property in the indicator configuration.
Volume not avalilable or not reliable
Unfortunately you CANNOT build the Volume Profile on all instruments. Some instruments (such as most of Forex CFDs) have not Volume, or Volume is NOT a reliable data. For this reason you cannot build a Volume Profile on this type of instruments, or it does not make much sense to do that.
Post a Comment